Reports
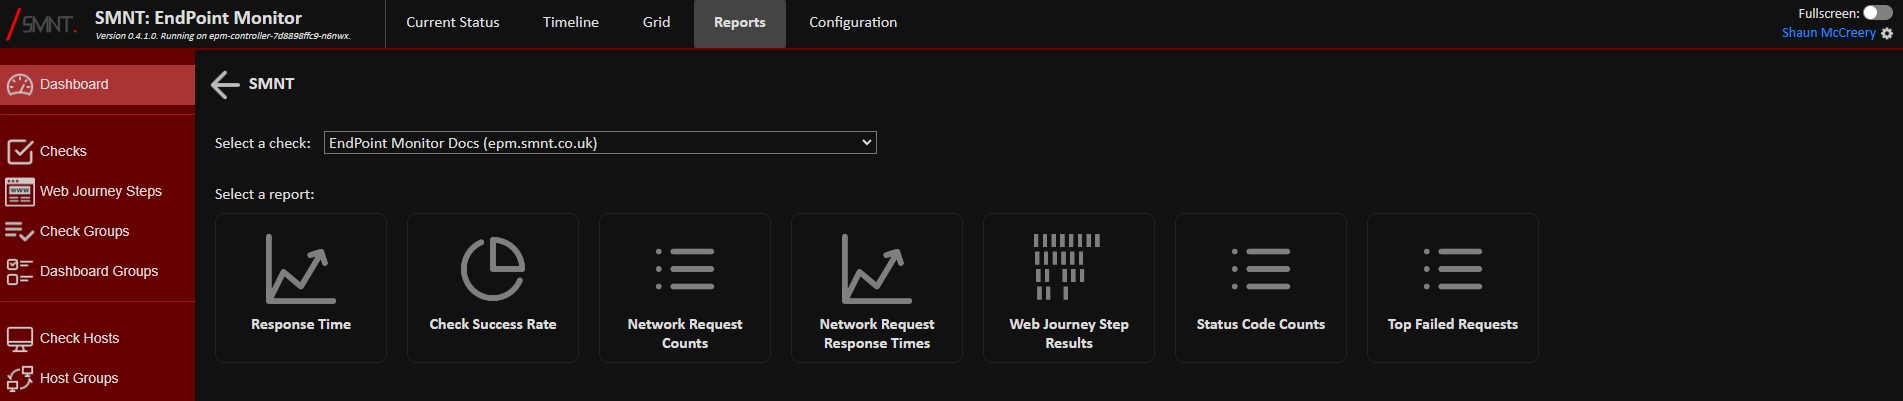
Some basic reporting on the historic results of checks is available by clicking the Reports option at the top of the web console.
The reports available depend on the type of check selected. Chose the Check you want to report on using the 'Select A Check' dropdown, which will then present the types of report available for it. Click on the report type and it will be displayed
| Report | Check Type | Description |
|---|---|---|
| Check Success Rate | All | The % split of successful and failed checks. Checks made when in a maintenance mode will not be counted either way. |
| Response Time | URL Check | The response for the monitored URL, measured from start of request to the end of the response. |
| Response Time | Ping Check | The response time of each ping made. |
| Response Time | Web Journey Check | The initial page render time captured at the start of each Web Journey. |
| Network Request Counts | Web Journey Check | This plots the number of each type of request made throughout an entire Web Journey. |
| Network Request Response Times | Web Journey Check | This plots the response times of the network calls made throughout whole Web Journey. This can be slow to render on large Web Journeys or Web Journeys will many network requests happening. |
| Web Journey Step Results | Web Journey Check | Provides a gantt chart of the time and result of each step made as part of a Web Journey Check. |
| Status Code Counts | Web Journey Check | Shows the counts of status codes received as part of the Web Journey. |
| Top Failed Requests | Web Journey Check | Lists the network requests that failed the most throughout the whole Web Journey. |