Dashboard Groups
Checks in EndPoint Monitor are grouped in two tiers. The top level tier is Dashboard Groups. Dashboard Groups then contain Check Groups, with the Check Groups containing the Checks themselves. These groups are largely just organisational and don't have any impact of the running of checks themselves, however the web console dashboard will only ever show one Dashboard Group at a time.
For smaller setups only the default initial Dashboard Group is likely required, for larger installations these can be split up however desired, be it by business units, application tiers or geographic locations. Well structured grouping can also ease the management of Maintenance Periods and Notifications.
Adding Dashboard Groups
Dashboard Groups can be created through the web console, through the API or using Terraform.
The below instructions describe how to add an Dashboard Group through the web console:
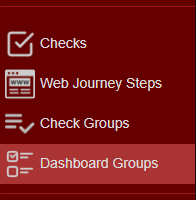
- Login to Web Console and select Dashboard Groups from the main menu.
- Click
Add located towards the top left of the web console. - The Create Dashboard Group window should now show. Provide and name and description for the new Dashboard Group.

- Click
Save . - You should now see confirmation that the Dashboard Group was successfully created in the bottom right notification area
in the web console.
An additional default Check Group will also be added to the newly created Dashboard Group too, namedDefault Group.
Amending Dashboard Groups
- Login to Web Console and select Dashboard Groups from the main menu.
- Check
Edit on the row of the Dashboard Group to update.
You can filter our the list of Dashboard Groups shown by name or description using the search bar. - Change the name and description of the Dashboard Group as required.

- Click
Save . - You should now see confirmation that the Dashboard Group was successfully updated in the bottom right notification area in the web console.
Removing Dashboard Groups
- Login to Web Console and select Dashboard Groups from the main menu.
- Check
Remove on the row of the Dashboard Group to remove.
You can filter our the list of Dashboard Groups shown by name or description using the search bar. - Click
Remove to confirm you want to delete the selected Dashboard Group. - The Dashboard Group should now be archived and any Check Groups still associated will also be archived at the same time.
If the Dashboard Group still contained checks then an error will be shown saying the Dashboard Group could not be deleted because of this.