Dashboard
The dashboard provides a multiple visual representations of the status of every check configured in EndPoint Monitor.
The EndPoint Monitor web console will default to the Dashboard view if nothing else is selected, but can also be
accessed using the Dashboard menu option.
Dashboard views are filtered by Dashboard Groups. If a Dashboard Group has not been selected, the Dashboard Group
selection will initially show. These are RAG colour coded to indicate the 'worst' state of all checks contained
(e.g. it if a single check has failed in that Dashboard Group, then it will show red to indicate this). Click on any
Dashboard Group to then show the status of all checks within it, or alternatively use the Dashboard Group dropdown
selection in the top right.

Current Status
The Current Status view is the default dashboard view. From here you can see an overview of the status of all checks within the selected Dashboard Group. Additionally you can manage many aspects of the checks from this dashboard view too.
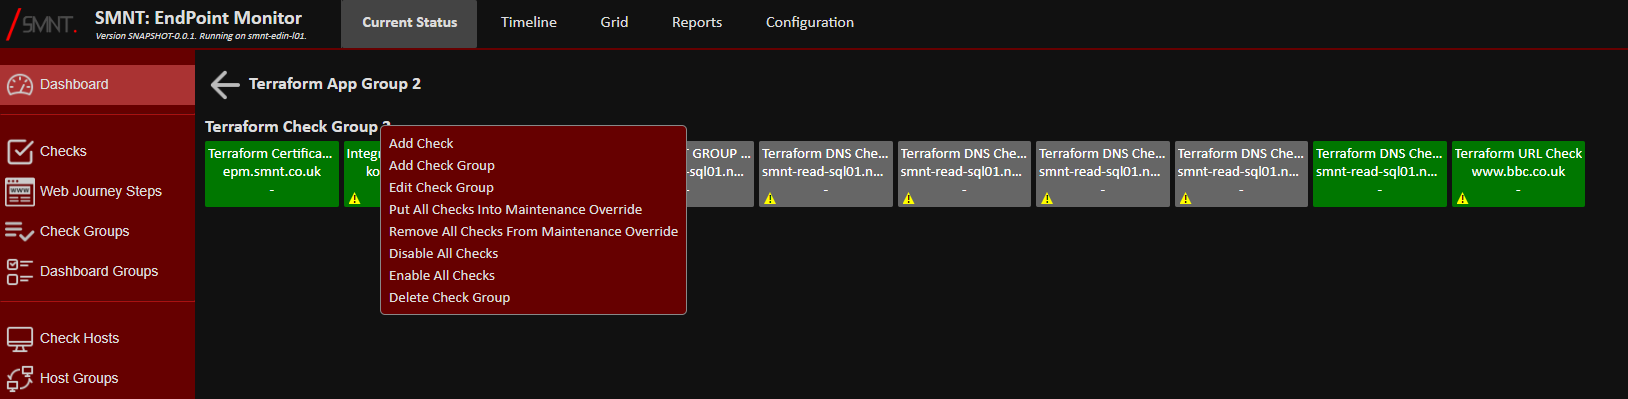
The checks are grouped by their corresponding Check Group, and then displayed in check name alphabetical order. Right
click on any Check Group name to show options available about configuring checks within, which includes bulk actions
such as enabling/disabling all or adding all into a maintenance override.
Check Status Boxes
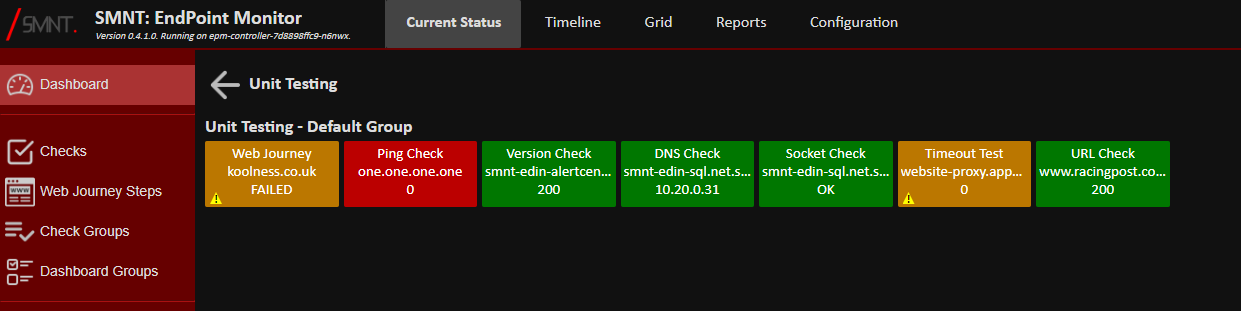
Each check in the selected Dashboard Group will be displayed in a 'status box' under its given Check Group name. The color of
each status box indicates the status from the last time the check ran.
| Colour | Meaning |
|---|---|
| Green | The check last ran with no issues. |
| Yellow | The check returned warnings when last ran. |
| Amber | The check returned warnings or failures on its last run but is in maintenance mode. |
| Red | The check returned failures on its last run. |
| Grey | The check is disabled |
The status box also shows some high level details of each check.
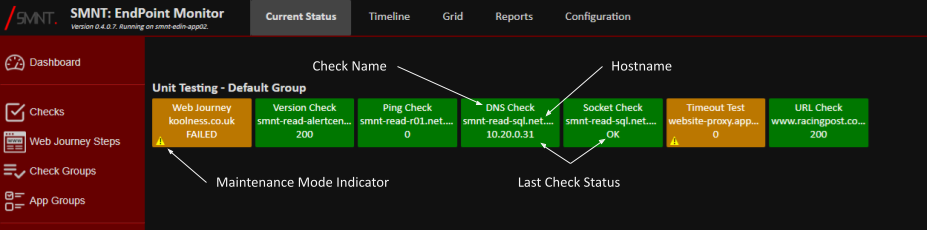
The Last Check Status option will show different information depending on the type of the check.
| Check Type | Last Status Value |
|---|---|
| URL Check | The last status code returned from the URL being monitored, or 0 if it didn't get a response at all. |
| Socket Check | OK if the socket was successfully established, or FAILED if not. |
| Ping Check | The response time of the ping request in milliseconds. |
| DNS Check | The first IP address resolved on the last resolution request. |
| Web Journey Check | OK if the journey completed with no issues, WARNING one or more of the checks hit a warning condition of FAILED if the check failed somewhere on the journey. |
| TLS Certificate | The number of days remaining on the certificate. |
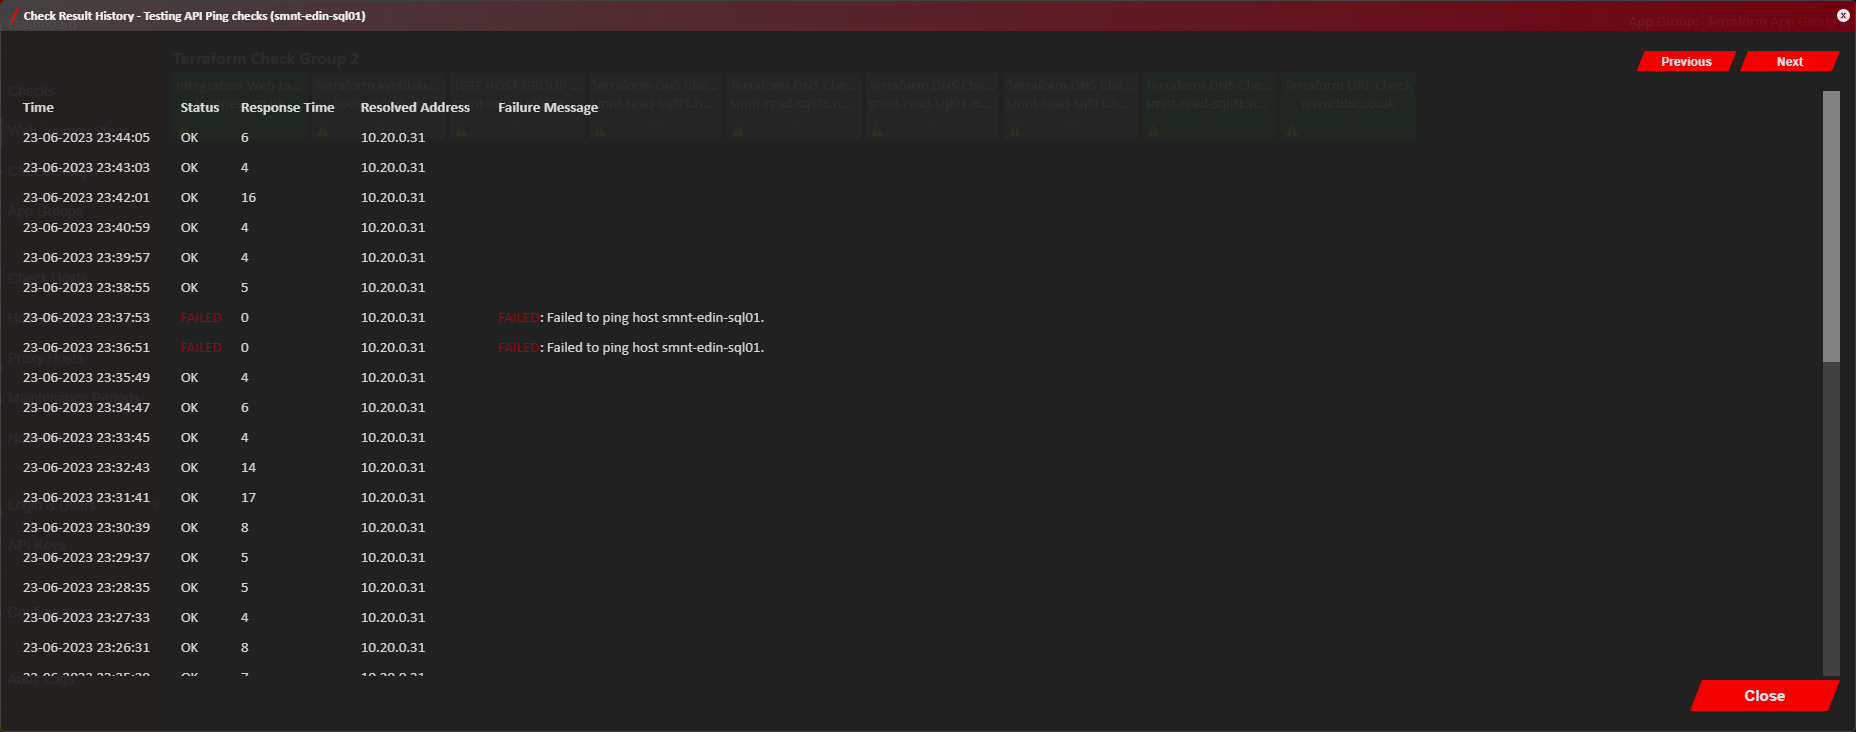
Left Click on any status box and this will show history of all runs of this check.
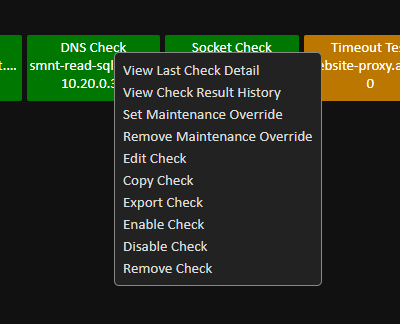
Right Click on any status box to view a menu of configuration options for the clicked on check.
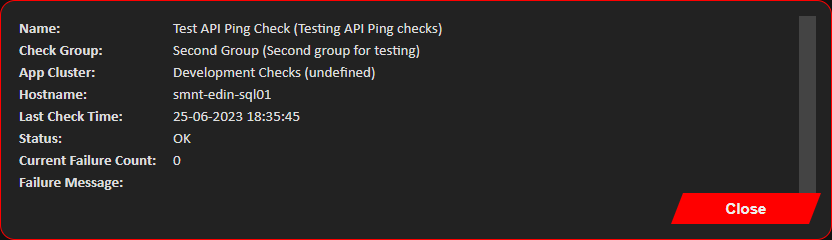
Hovering the mouse over any status box will also show more detail of the last check completed against it.
Timeline View
The Dashboard Timeline View gives overview of how all checks in the selected Dashboard Group have performed within a recent
time period.
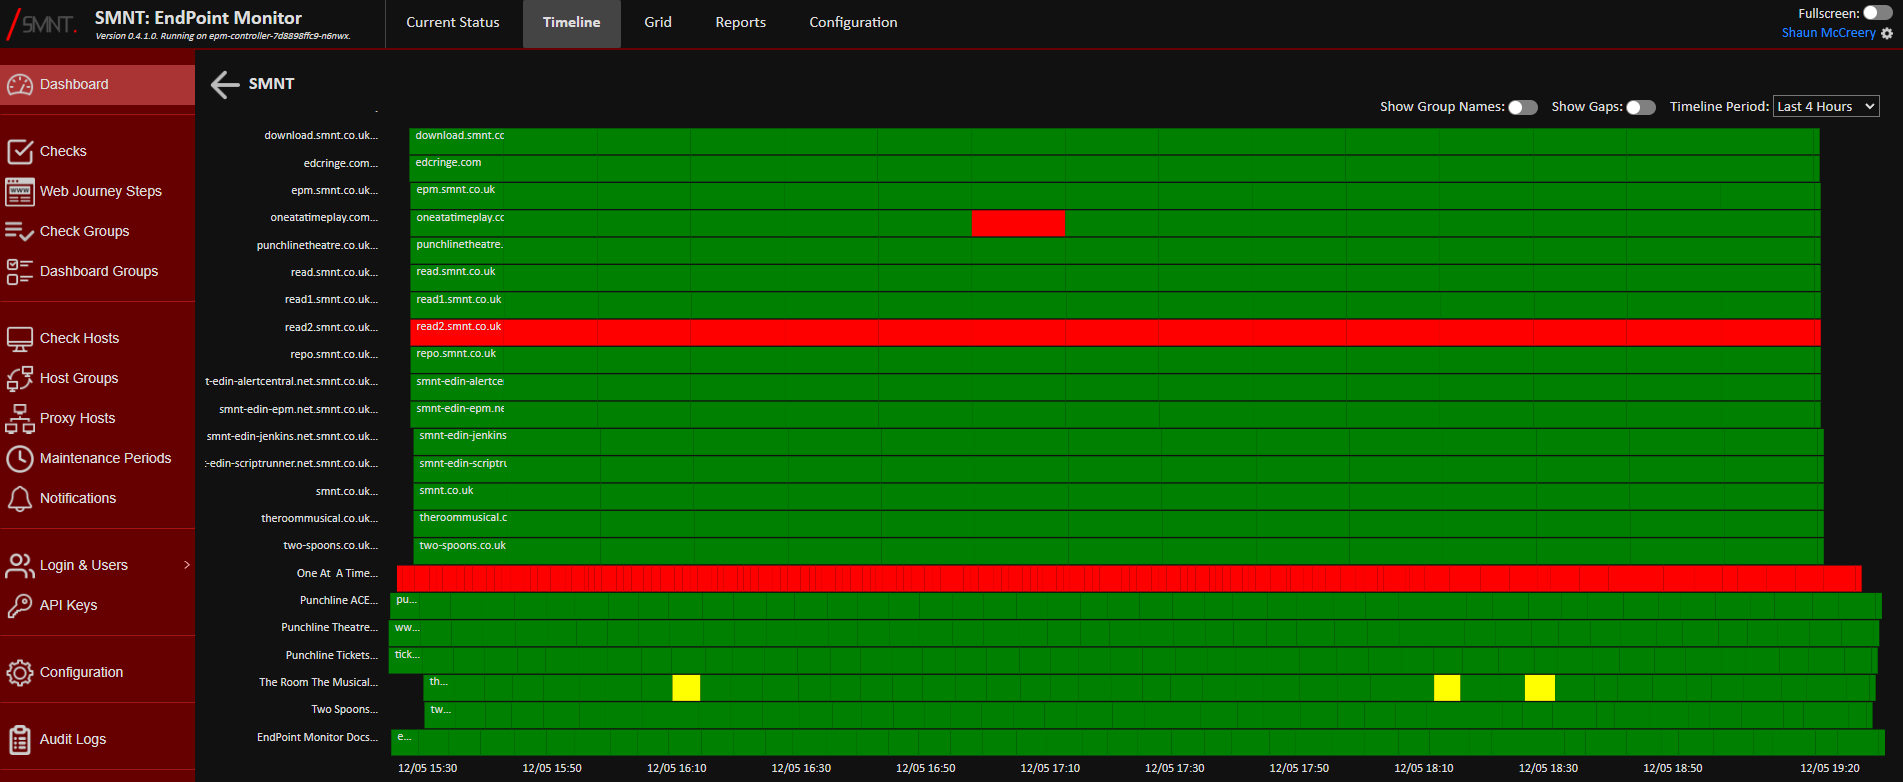 The period of time shown on the Timeline view can be adjusted using the Timeline Period option, with the furthest right
side of the timeline always being the current time. Historic periods can not be shown currently. Depending on how many
checks and their frequency, selecting long periods on the Timeline Period can take a long time to render.
The period of time shown on the Timeline view can be adjusted using the Timeline Period option, with the furthest right
side of the timeline always being the current time. Historic periods can not be shown currently. Depending on how many
checks and their frequency, selecting long periods on the Timeline Period can take a long time to render.

The Show Group Names option will change the visibility of the Check Group names on the timeline. The Show Gaps
option will fill in any gaps within the check frequency if toggled on, or merge checks into a continuous line if
toggled on. Gaps between checks count as the time between the time of a check starting + its check interval, and the
time the next check started.
Hovering the mouse over any check in the timeline view will show a box summarising that check result, including any
reasons the check failed or was set as a warning. Checks can not be configured from this dashboard view unlike the
Current Status view.
Grid
The Dashboard Grid view provides a minimal, high level view of the status of all checks for the selected Dashboard Group.
This minimal view is useful when a Dashboard Group contains a high number of checks and a single view is wanted of the
status of all of these checks.
If Hide Disabled is set to Yes, then any checks that currently have their Enabled flag toggled off will not be displayed
at all. If set to no, then they will be displayed as grey boxes.
Each check is represented by a box, and the colour of this box informs the outcome of the last time the check was run.
| Colour | Meaning |
|---|---|
| Green | The check last ran with no issues. |
| Yellow | The check returned warnings when last ran. |
| Amber | The check returned warnings or failures on its last run but is in maintenance mode. |
| Red | The check returned failures on its last run. |
| Grey | The check is disabled |
The value shown in each box indicates
| Check Type | Last Status Value |
|---|---|
| URL Check | The last status code returned from the URL being monitored, or 0 if it didn't get a response at all. |
| Socket Check | OK if the socket was successfully established, or FAILED if not. |
| Ping Check | The response time of the ping request in milliseconds. |
| DNS Check | The first IP address resolved on the last resolution request. |
| Web Journey Check | OK if the journey completed with no issues, WARNING one or more of the checks hit a warning condition of FAILED if the check failed somewhere on the journey. |
Clicking on any box in the Grid view will bring up a summary of the result of the last check run, providing a quick
view to why it may be showing a warning or failure.